Sole Street Rent Guide and Insights
Discover Sole Street's 2026 rental market: average rents for flats vs. houses, bedroom-count breakdowns, % of homes with gardens or balconies, plus an interactive postcode heatmap.

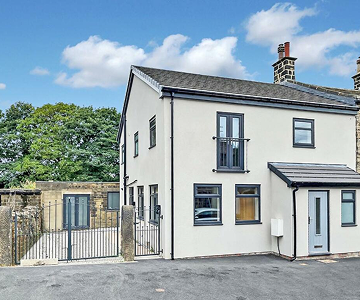
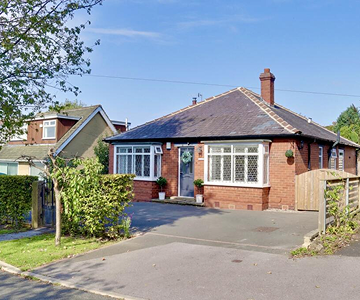
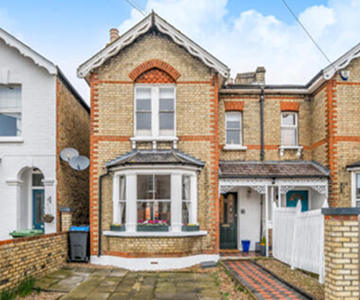
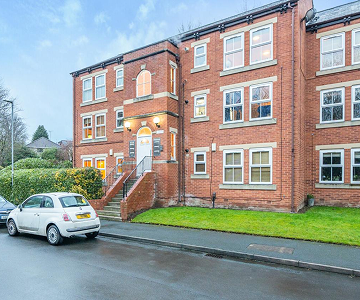
Houses
Explore rental insights, market trends, and average rents for houses in the area!
What is the average rent for a house in Sole Street?
The average monthly rent for a house in Sole Street is £2,003, costing on average £1 per sqft.
Average rents for houses by bedroom count are: £1,392 for a two-bedroom, £1,926 for a three-bedroom, £2,315 for a four-bedroom, and £3,250 for a five-bedroom.
What share of houses in Sole Street feature gardens and parking?
In Sole Street, 90% of houses have a garden and 77% include parking.
What is the breakdown of property types in Sole Street?
The housing mix in Sole Street is 29% detached, 26% semi-detached, 34% terraced, and 13% other.
What is the most expensive area in Sole Street to rent a home?
The most expensive area to rent a house in Sole Street is DA13, where the average monthly rent is £2,394.
What is the cheapest area in Sole Street to rent a home?
The cheapest area to rent a house in Sole Street is DA12, where the average monthly rent is £1,612.
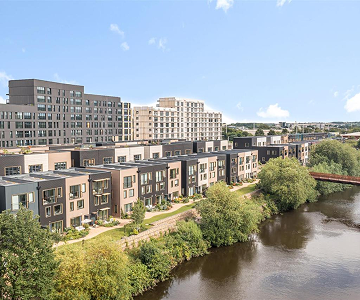
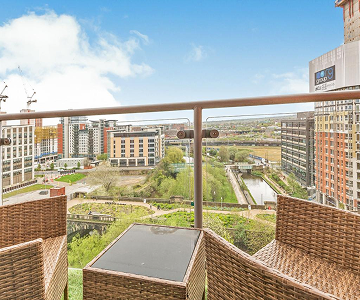
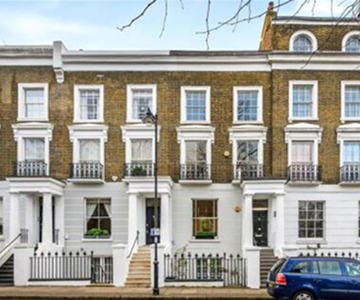
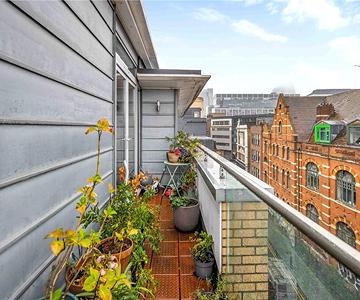
Flats and apartments
Explore rental insights, market trends, and average rents for flats in the area!
What is the average rent for a flat in Sole Street?
The average monthly rent for a flat in Sole Street is £1,251, costing on average £2 per sqft per month.
Average rents for flats by bedroom count are: £1,007 for a one-bedroom, £1,342 for a two-bedroom, £1,552 for a three-bedroom, and £1,800 for a four-bedroom.
What share of flats in Sole Street feature balconies and parking?
In Sole Street, 21% of flats have a balcony and 76% include parking.
What is the most expensive area in Sole Street to rent a flat?
The most expensive area to rent a flat in Sole Street is DA12, where the average monthly rent is £1,269.
What is the cheapest area in Sole Street to rent a flat?
The cheapest area to rent a flat in Sole Street is DA13, where the average monthly rent is £1,233.
Looking to rent in Sole Street?
Searching for your next home doesn't have to be endless evenings and hundreds of tabs. When a property you want comes on the market, we'll let you know.