Hyndburn Rent Guide and Insights
Discover Hyndburn's 2026 rental market: average rents for flats vs. houses, bedroom-count breakdowns, % of homes with gardens or balconies, plus an interactive postcode heatmap.

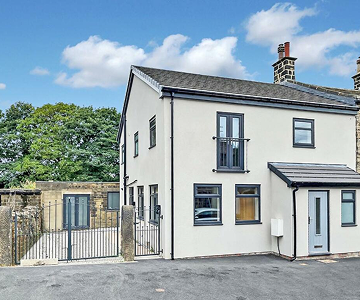
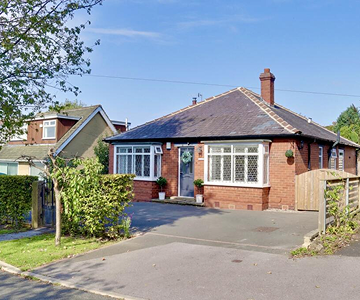
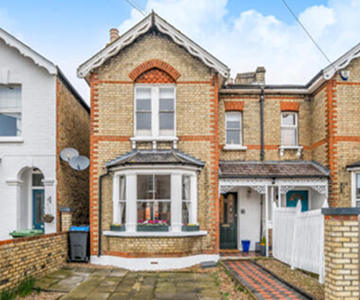
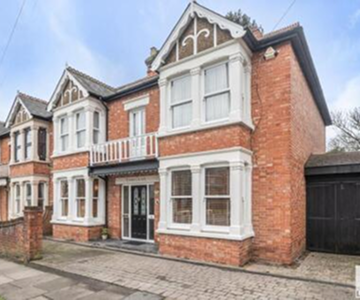
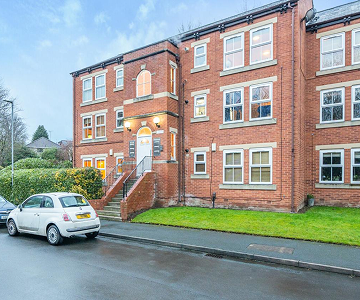
Houses
Explore rental insights, market trends, and average rents for houses in the area!
What is the average rent for a house in Hyndburn?
The average monthly rent for a house in Hyndburn is £925, costing on average £1 per sqft.
Average rents for houses by bedroom count are: £759 for a two-bedroom, £1,095 for a three-bedroom, £1,478 for a four-bedroom, and £1,450 for a five-bedroom.
What share of houses in Hyndburn feature gardens and parking?
In Hyndburn, 77% of houses have a garden and 62% include parking.
What is the breakdown of property types in Hyndburn?
The housing mix in Hyndburn is 11% detached, 24% semi-detached, 61% terraced, and 4% other.
What is the most expensive area in Hyndburn to rent a home?
The most expensive area to rent a house in Hyndburn is BB7, where the average monthly rent is £1,095. The second and third most expensive areas are BB1 with an average rent of £926 and BB6 with an average rent of £923 .
What is the cheapest area in Hyndburn to rent a home?
The cheapest area to rent a house in Hyndburn is BB5, where the average monthly rent is £754. The second and third cheapest areas are BB6 with an average rent of £923 and BB1 with an average rent of £926 .
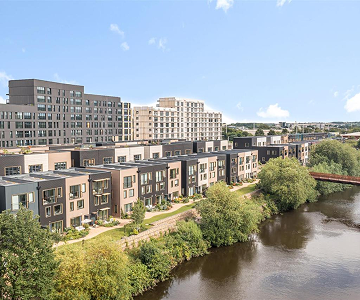
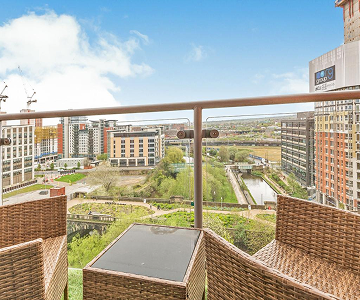
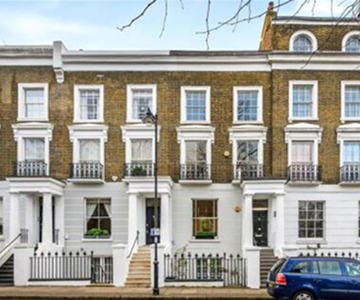
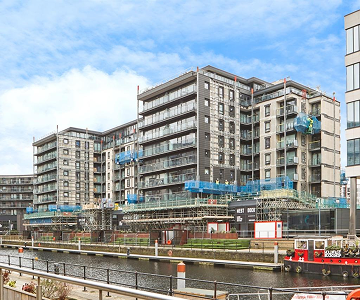
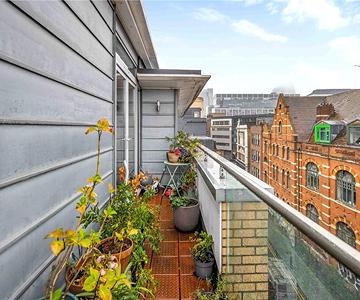
Flats and apartments
Explore rental insights, market trends, and average rents for flats in the area!
What is the average rent for a flat in Hyndburn?
The average monthly rent for a flat in Hyndburn is £662, costing on average £1 per sqft per month.
Average rents for flats by bedroom count are: £602 for a one-bedroom, £739 for a two-bedroom, £848 for a three-bedroom, and £950 for a four-bedroom.
What share of flats in Hyndburn feature balconies and parking?
In Hyndburn, 5% of flats have a balcony and 63% include parking.
What is the most expensive area in Hyndburn to rent a flat?
The most expensive area to rent a flat in Hyndburn is BB7, where the average monthly rent is £710. The second and third most expensive areas are BB1 with an average rent of £704 and BB6 with an average rent of £638 .
What is the cheapest area in Hyndburn to rent a flat?
The cheapest area to rent a flat in Hyndburn is BB5, where the average monthly rent is £596. The second and third cheapest areas are BB6 with an average rent of £638 and BB1 with an average rent of £704 .
Looking to rent in Hyndburn?
Searching for your next home doesn't have to be endless evenings and hundreds of tabs. When a property you want comes on the market, we'll let you know.