Chartway Street Property Price Guide and Insights
Discover Chartway Street's 2026 property market: average prices for flats vs. houses, bedroom-count breakdowns, % of homes with gardens or balconies, plus an interactive postcode heatmap.

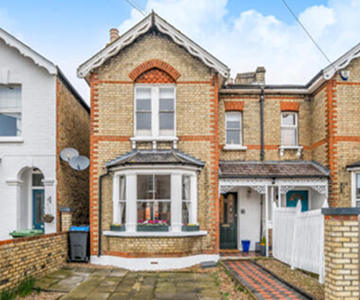
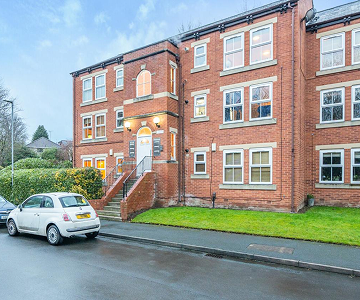
Houses
Explore our blog for market insights, guides and a sprinkling of our favourite properties!
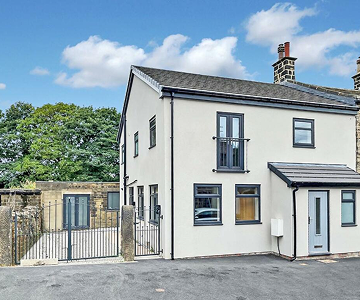
What is the average price of a house in Chartway Street?
The average price for a house in Chartway Street is £521k, costing on average £413 per sqft.
Average prices of houses by bedroom count are: £318k for a two-bedroom, £410k for a three-bedroom, £640k for a four-bedroom, and £879k for a five-bedroom.
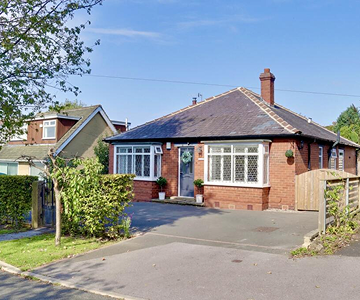
What share of houses in Chartway Street feature gardens and parking?
In Chartway Street, 91% of houses have a garden and 93% include parking.
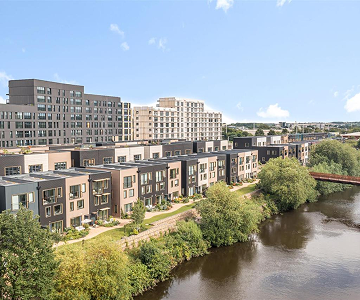
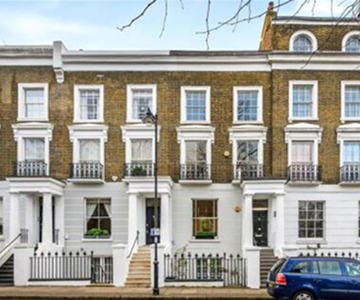
What is the breakdown of property types in Chartway Street?
The housing mix in Chartway Street is 44% detached, 29% semi-detached, 10% terraced, and 17% other.
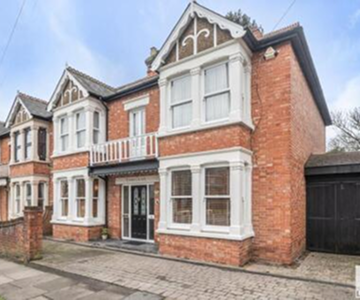
What is the most expensive area in Chartway Street to buy a home?
The most expensive area to buy a house in Chartway Street is ME17, where the average property is £521k.
What is the cheapest area in Chartway Street to buy a home?
The cheapest area to buy a house in Chartway Street is ME17, where the average property is £521k.
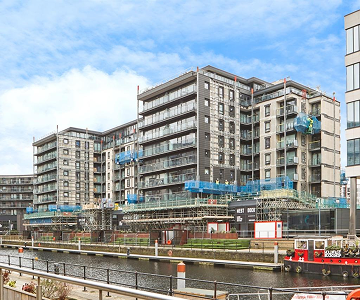
Flats and apartments
Explore our blog for market insights, guides and a sprinkling of our favourite properties!
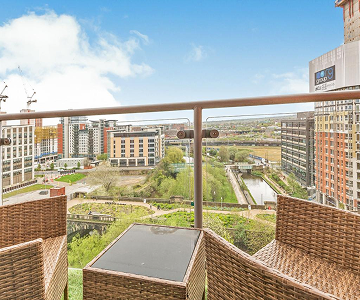
What is the average price of a flat in Chartway Street?
The average price for a flat in Chartway Street is £269k, costing on average £493 per sqft.
Average prices of flats by bedroom count are: £137k for a one-bedroom, £231k for a two-bedroom, £550k for a three-bedroom, and £875k for a four-bedroom.
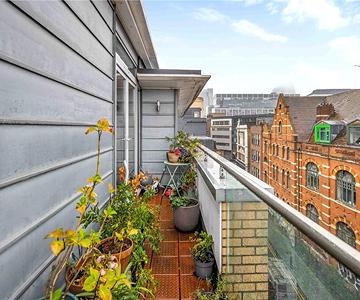
What share of flats in Chartway Street feature balconies and parking?
In Chartway Street, 31% of flats have a balcony and 92% include parking.
What is the breakdown of lease types in Chartway Street?
The leasing mix in Chartway Street is 96% leasehold and 4% freehold.
What is the most expensive area in Chartway Street to buy a flat?
The most expensive area to buy a flat in Chartway Street is ME17, where the average property is £269k.
What is the cheapest area in Chartway Street to buy a flat?
The cheapest area to buy a flat in Chartway Street is ME17, where the average property is £269k.
Looking for a property in Chartway Street?
Searching for your next home doesn't have to be endless evenings and hundreds of tabs. When a property you want comes on the market, we'll let you know.
Nearby
Explore our price guides for different nearby postcodes. Each guide provides insights into the local market, average prices, and trends to help you make informed decisions.